Register deprivation: spills and runtime under forced register scarcity
We compiled nine small kernels while progressively reserving registers with
gcc -ffixed-<reg>, then measured spills and runtime on one machine. Reserving
registers reliably increases spills, but the static spill count is a weak
predictor of the runtime cost, and one kernel gains 23 spills with no slowdown
at all.
Code is at https://github.com/rjpower/spillbench; the numbers behind every
figure below are in results.json.
TL;DR
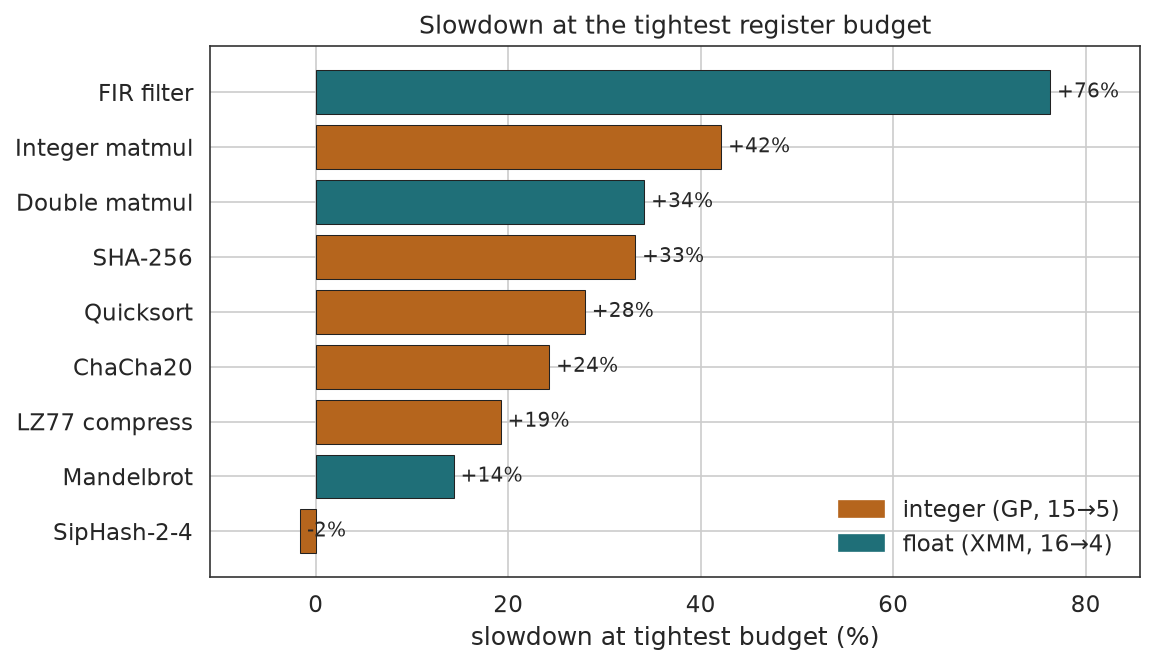
- Removing registers slows 8 of 9 kernels by 14–76% at the tightest budget; the ninth (SipHash) does not move. Results are bit-identical at every budget, so the reservation only changes generated code, not the computation.
- Added spill instructions correlate weakly with slowdown (Pearson r = 0.55 over 105 points). The cost of one added spill ranges from about 0%/spill (SipHash) to 2.2%/spill (FIR filter), a ~30× spread.
- The effect is specific to the register file the kernel uses. Reserving XMM registers on SHA-256 costs +5.6%; reserving GP registers costs +33%. Reserving GP registers on a double-precision matmul is flat; reserving XMM costs +34%.
- GCC auto-vectorizes part of SHA-256 with SSE at
-O2, so reserving XMM is not inert for that integer kernel: its stack-spill count rises 8→65 while runtime moves +5.6%. - Measured with
gcc 15.2.0 -O2on an Intel Xeon E-2236, wall-clock, minimum of 15 repetitions on one pinned core.
Setup
We test three hypotheses:
- H1: fewer registers produce more spills and slower code, monotonically in the number of registers removed.
- H2: the slowdown is specific to the register file the kernel actually uses (integer kernels to GP registers, floating-point kernels to XMM).
- H3: the static spill count predicts the runtime cost.
We reserve registers with gcc -ffixed-<reg>, which removes a register from the
allocator's pool for the whole compilation. We recompile each kernel once per
budget, adding one reservation each pass. GP kernels give up
r15 r14 r13 r12 rbp rbx r11 r10 r9 r8 in that order (15 allocatable registers
down to 5; rsp is never allocatable). XMM kernels give up xmm15 … xmm4 (16
down to 4). We never reserve the ABI registers (rax rcx rdx rsi rdi, xmm0–3),
which argument passing and instructions like mul and variable shifts require.
Six integer kernels exercise the GP file, three floating-point kernels exercise the XMM file. Each is a single C function with a known-answer test.
| Kernel | File | What it is | Correctness check |
|---|---|---|---|
| ChaCha20 | GP | 20-round stream cipher block, 16×32-bit state | RFC 8439 §2.3.2 keystream |
| SHA-256 | GP | compression function, 8 vars + 64-word schedule | SHA-256("abc") |
| SipHash-2-4 | GP | keyed hash, 4×64-bit ARX | reference vector (15-byte msg) |
| Integer matmul | GP | 4×4 register-blocked int64 micro-kernel | vs. naive triple loop |
| LZ77 compress | GP | hash-chain match finder | compress→decompress round-trip |
| Quicksort | GP | in-place recursive sort of int32 | output is sorted |
| Double matmul | XMM | 4×4 register-blocked f64 micro-kernel | vs. naive triple loop |
| FIR filter | XMM | 16-tap filter, 8 output lanes | vs. naive tap sum |
| Mandelbrot | XMM | escape-time, few live doubles per pixel | escape counts at known points |
For the spill metric, we disassemble the hot function (objdump) and count
instructions that reference a fixed stack slot (…(%rsp)), excluding indexed
array access. This is a static proxy for spill/reload traffic. We do not have
dynamic spill counts: hardware performance counters are disabled in this
environment (perf_event_paranoid=4).
For timing, a Rust harness dlopens each build, runs its known-answer test, and
times the whole workload with a monotonic clock, keeping the minimum over 15
repetitions on one pinned core. Each kernel's workload is sized to ~100 ms.
Machine: Intel Xeon E-2236 @ 3.40 GHz, gcc 15.2.0, -O2 -fPIC -shared.
Every build passes its known-answer test, and every kernel returns the same checksum at all budgets. Reservation is a pure allocation constraint here; it never changed a result.
Result 1: removing registers slows most kernels, but not all
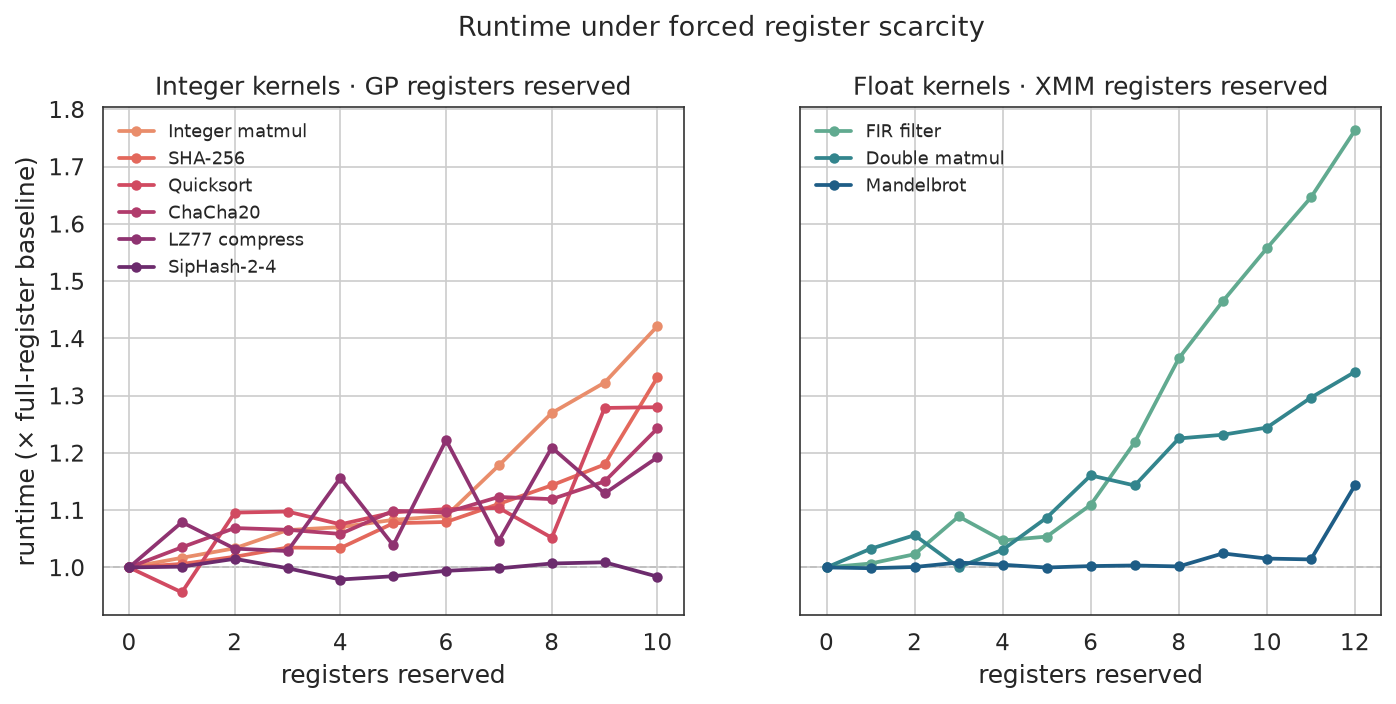
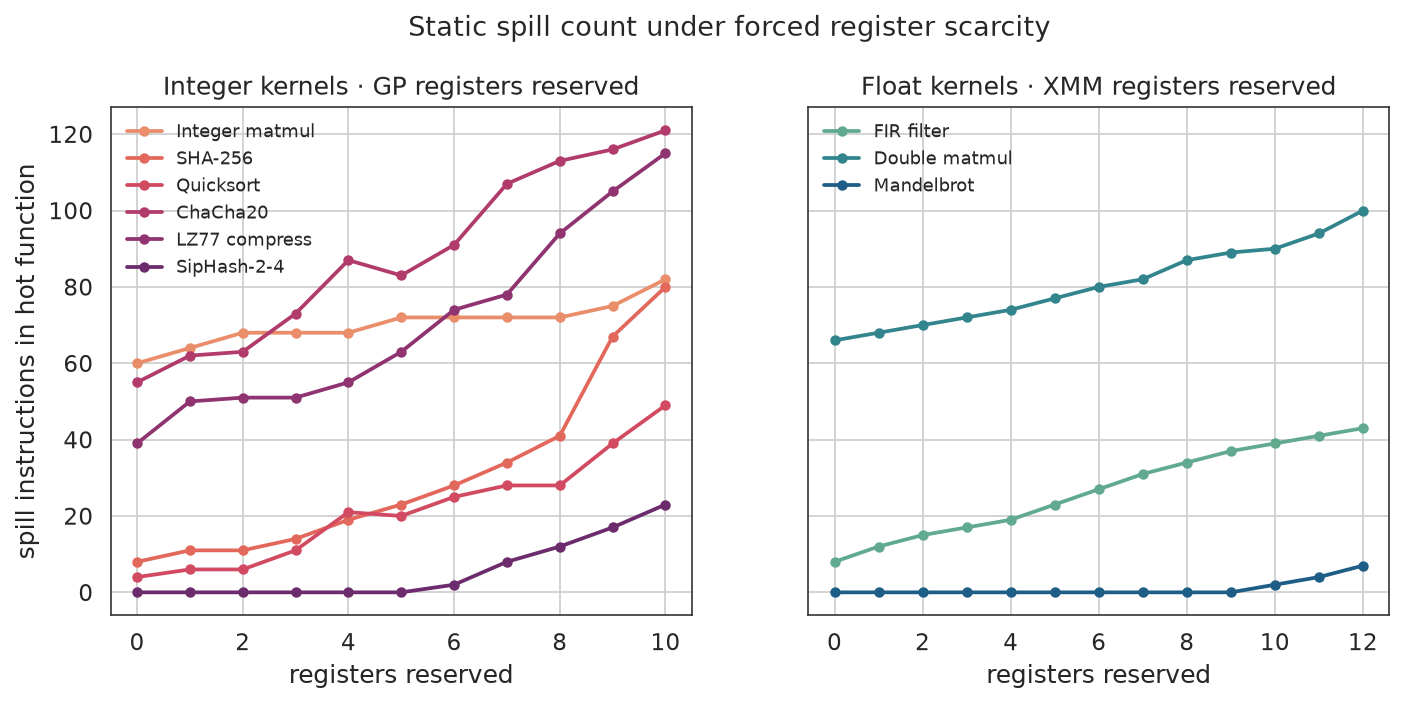
Eight of nine kernels slow down as registers are removed; SipHash-2-4 does not.
| Kernel | File | Runtime full→min (ms) | Slowdown | Spills full→min |
|---|---|---|---|---|
| FIR filter | XMM | 135.5 → 238.9 | +76% | 8 → 43 |
| Integer matmul | GP | 140.5 → 199.7 | +42% | 60 → 82 |
| Double matmul | XMM | 131.5 → 176.4 | +34% | 66 → 100 |
| SHA-256 | GP | 89.4 → 119.0 | +33% | 8 → 80 |
| Quicksort | GP | 134.2 → 171.7 | +28% | 4 → 49 |
| ChaCha20 | GP | 88.5 → 110.0 | +24% | 55 → 121 |
| LZ77 compress | GP | 123.2 → 146.8 | +19% | 39 → 115 |
| Mandelbrot | XMM | 101.6 → 116.2 | +14% | 0 → 7 |
| SipHash-2-4 | GP | 79.4 → 78.1 | −2% | 0 → 23 |
Spill counts rise for all nine kernels. Runtime rises for eight. H1 holds in direction but not in shape: neither curve is cleanly monotonic in the budget. Static spills drop when a register is removed in a few cases (ChaCha20 and Quicksort each have one such step), and the runtime curves have local dips within measurement noise (LZ77 has 5 steps that decrease by more than 0.5 ms as budget falls, SipHash 3, Quicksort 3). The allocator is not monotone, and the runtime signal is noisy at the ~1% level even with minimum-of-15 timing.
Integer matmul starts at 60 spills with a full register file: its 4×4 block holds 16 int64 accumulators, already more than the 15 allocatable GP registers, so it spills before we take anything away.
Result 2: the spill count does not predict the slowdown
The number of added spills explains little of the slowdown.
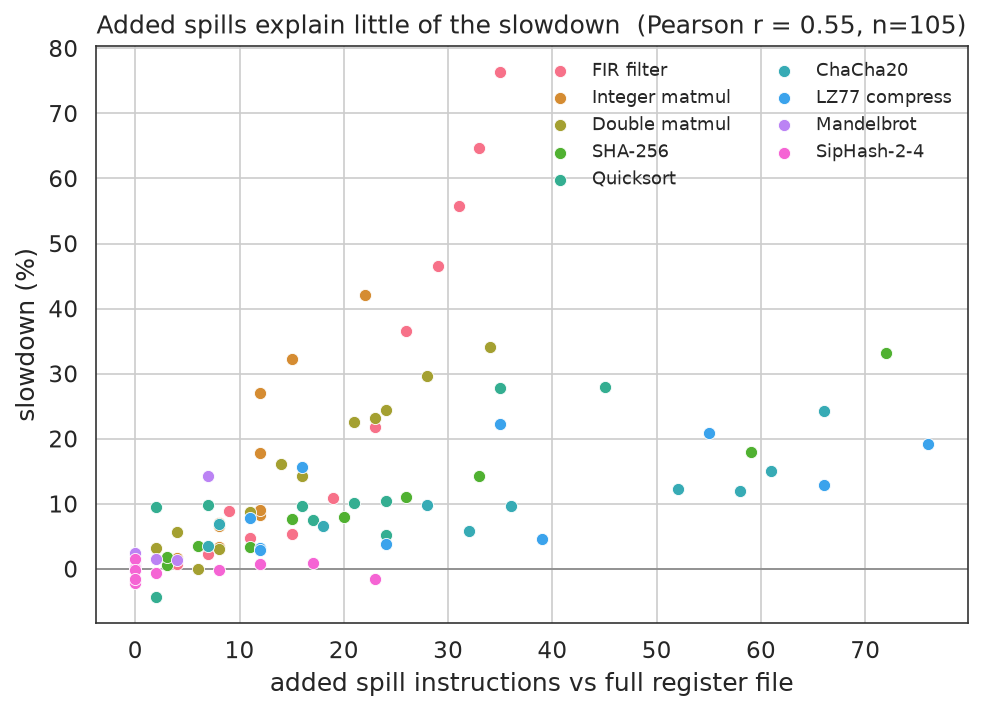
Across all 105 (kernel, budget) points, Pearson r between added spills and slowdown is 0.55. The per-kernel cost of a spill varies by about 30×:
| Kernel | Added spills at min | Slowdown | Slowdown per added spill |
|---|---|---|---|
| FIR filter | +35 | +76% | 2.18 %/spill |
| Mandelbrot | +7 | +14% | 2.05 %/spill |
| Integer matmul | +22 | +42% | 1.92 %/spill |
| Double matmul | +34 | +34% | 1.00 %/spill |
| Quicksort | +45 | +28% | 0.62 %/spill |
| SHA-256 | +72 | +33% | 0.46 %/spill |
| ChaCha20 | +66 | +24% | 0.37 %/spill |
| LZ77 compress | +76 | +19% | 0.25 %/spill |
| SipHash-2-4 | +23 | −2% | ≈0 %/spill |
Integer matmul reaches +42% with only 22 added spills; LZ77 adds 76 spills for +19%. SipHash adds 23 spills with no measurable slowdown. We think the explanation is that the stack lives in L1, so a spill that is not on the critical dependency path is nearly free, while a spill inside a tight recurrence (the ARX chain, the accumulator update) serializes on the reload latency. The static count does not distinguish the two.
Result 3: the slowdown is specific to the register file
Reserving the register file a kernel does not use is much cheaper than reserving the file it does.
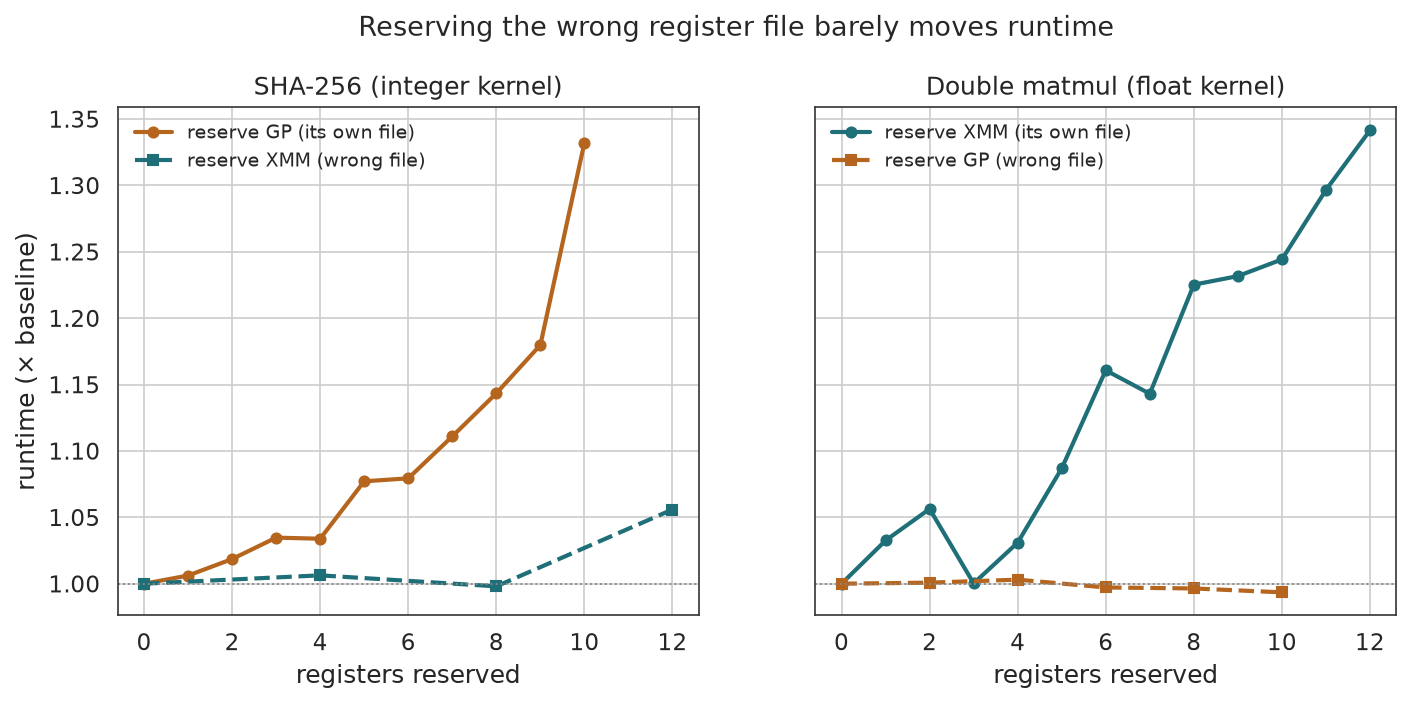
We reran two kernels against the opposite register file. Reserving GP registers on the double-precision matmul is flat (131.9 → 131.1 ms across 0→10 reserved); reserving XMM on the same kernel costs +34%. This is the clean case: the floating-point work is XMM-bound and has GP registers to spare.
SHA-256 is the messy case. Reserving XMM costs +5.6%, against +33% for GP. But
XMM reservation is not inert: SHA-256's stack-spill count rises 8→65. Its hot
function contains 155 XMM-referencing instructions at full budget, because GCC
auto-vectorizes the message-schedule byte-swapping and word computation with SSE
at -O2. Reserving XMM forces that work back onto GP registers and the stack,
which shows up as stack spills but barely as runtime, because the schedule is not
the critical path. So H2 holds for runtime, with the caveat that "the file the
kernel uses" is not clean: GCC uses XMM opportunistically inside integer code.
What surprised us
- Spill count is a weak runtime predictor (r = 0.55, 30× spread in cost per spill). We expected a tighter relationship, since the spill count is what the register-pressure story is usually told with.
- SipHash gains 23 stack spills for a −2% change in runtime. Spills off the critical path, into L1-resident stack, are close to free here.
- Quicksort is not a flat control. Its live set is small (two cursors, a pivot, a swap), but the partition loop still spills once the GP file is tight, and it slows +28%.
- Reserving XMM registers changed an integer kernel's stack-spill count by 8×, because GCC auto-vectorizes part of SHA-256. The register files are less separable than the "integer vs float" framing suggests.
- Removing a register sometimes lowers the static spill count. The allocator's output is not monotone in the size of the register file.
Historical note: what would this have cost on x86-32?
This section is extrapolation, not measurement. Read it as a back-of-envelope, not a result.
32-bit x86 had eight GP registers, but esp is never allocatable and ebp is
usually the frame pointer, so real code had six or seven to work with, against
fifteen here. Our sweep has points at exactly those budgets, so we can read the
cost off the curve instead of guessing:
| Usable GP registers | Mean, 6 integer kernels | 32-bit-native kernels | Hungriest (int matmul / SHA-256) |
|---|---|---|---|
| 7 (≈ x86-32, frame ptr omitted) | +13% | +16% | +27% / +14% |
| 6 (≈ x86-32, frame ptr kept) | +18% | +15% | +32% / +18% |
| 5 (tighter than x86-32 ever was) | +24% | +26% | +42% / +33% |
On this machine, going from 15 to 6–7 GP registers costs about 15% on a typical kernel and about 30% on the most register-hungry integer code. The popular "~30%" figure is defensible for the hungry tail, but it is roughly double the average kernel.
Two things make this an under-estimate of the real 1990s cost. First, a 64-bit
value occupies a register pair on x86-32, so the int64-heavy kernels (the
matmul, SipHash's lanes) would have felt pressure our -ffixed count does not
model. Second, and larger: the reason spills are cheap here is that the stack
lives in L1 and out-of-order execution overlaps the reload with other work.
Period hardware could not do that overlap.
The latency gap itself was, if anything, smaller then. Approximate load-use latency for a first-level-cache hit, in core clocks:
| CPU (year) | GP register | L1 hit | notes |
|---|---|---|---|
| 80386 (1985) | 0 | — | no on-chip cache; mov reg,[mem] ≈ 4 clk to external SRAM, DRAM adds wait states |
| 80486 (1989) | 0 | ~1 clk | 8 KB unified, write-through; DRAM miss ~10–20 clk |
| Pentium (1993) | 0 | ~1 clk | in-order dual pipe; off-chip L2 ~4–8 clk |
| Pentium II/III (1997–99) | 0 | ~3 clk | out-of-order (P6); spills start to be hideable |
| Xeon E-2236 (this box) | 0 | ~4–5 clk | ~220-entry reorder window hides the latency |
A 486 or original Pentium reload that hit L1 cost about one cycle, fewer than the four or five it costs on this Xeon. The problem was not the latency; it was that a single scalar (486) or dual in-order (Pentium) pipeline had no reorder window to fill while the load resolved, so a dependent reload stalled the pipe for its full latency and even an independent one consumed a pipe slot. On this Xeon the same reload issues into an otherwise-idle slot and overlaps unrelated work, which is why our spill count only weakly predicts runtime (r = 0.55). On an in-order 486 that correlation would be tighter and the cost per spill both higher and more uniform. Out-of-order execution, which arrived mid-x86-32-era with the Pentium Pro, is what turned a spill from a stall into an often-free move.
One thing cuts the other way, and it is why eight-register x86 aged better than an
eight-register load/store RISC would have: x86 is a two-operand, memory-operand
ISA, so a spilled value that is only read folds into the consuming instruction
(add eax,[ebp-8]) with no separate load. At a one-cycle L1 hit, a read-once
spill was nearly free even in-order. But that helps the cheap case, not the
expensive one. The costly spills in our data are recurrences — an accumulator or
an ARX chain read and written every iteration (SipHash is the extreme: 23 forced
spills, hidden to −2% here by out-of-order execution). A recurrence spill needs a
store plus a dependent reload on the critical path. The read-modify-store form
(add [mem],reg) does not fold to a free operand — it is ~3 clocks and
un-pairable on the Pentium — and two period details make the store side cost more
than a cycle: the 486's L1 was write-through, so every spill store hit the bus,
and the original Pentium had little store-to-load forwarding, so a value spilled
and immediately reloaded could stall until the store drained. Modern cores forward
store-to-load in a few cycles and reorder across iterations; an in-order Pentium
did neither.
So the floor claim is really about the tail. For streaming, read-once code the memory-operand ISA probably put the historical cost close to what we measure — the folded load and a one-cycle L1 hit largely absorb the pressure. For the recurrence-bound kernels (+30–42% here) in-order hardware likely paid more, because it could neither fold the read-modify-store nor hide it behind other work. As a sanity check, published x86-64-vs-x86-32 comparisons at the AMD64 launch generally landed in the ~5–15% range for general integer code and higher for register-hungry and SIMD work, consistent with our "≈15% average, ≈30% for the hungriest" split, though those numbers also fold in AMD64's other changes (a fixed calling convention, RIP-relative addressing, a doubled XMM file) and so overstate the register-only effect.
Limitations
- One machine, one compiler, one optimization level (
gcc 15.2.0 -O2). Clang/LLVM uses a different allocator and would likely produce different curves. - Static spill count is a proxy. Dynamic spill/reload counts would be a better measure; hardware counters were unavailable here.
- Wall-clock, not cycles or retired-µops. The signal is noisy at ~1% despite minimum-of-15 timing.
- Microbenchmarks with small, L1-resident working sets. A kernel whose spills miss cache would show a steeper cost-per-spill.
- Fixed reserve order. A different order (or targeting specific hot values) could change which values spill and shift the curves.
Reproduce
git clone https://github.com/rjpower/spillbench
cd spillbench/bench
taskset -c 3 cargo run --release --bin bench -- 15   # writes ../static/results.json
cd ../report
uv run --with matplotlib,seaborn,pandas,numpy python make_figures.py
The kernels are in bench/kernels/*.c, the harness in bench/src/main.rs, and the
figure script in report/make_figures.py. bench/README.md documents the reserve
orders and per-kernel details.